Did you ever imagine or have some curiosities about how network traffic look likes ? If you did, you are not alone, I did too. I didn’t know much about networking at that time. As far as I knew, when i was connecting to a Wi-Fi network, first I turned-on Wi-Fi service on my computer to scan available connection/s around me. And then, I tried to connect to target Wi-Fi access point, if it ask for password then input the password. Once it’s connected, now I could surf the internet. But, then I wonder, what is the scenario behind all of this? How could my computer know if there are a lot access points around it? Even I didn’t realize where are the routers placed. And once my computer connected to the router / access point what they are doing when i browsed the Internet? How do these devices (my computer and access point) communicate with each other?
That happened when i first installed my Kali Linux. My goal by installing Kali Linux was to solve any problems and my curiosities related to “some complex-technology stuff or hacking methods scenario and soon”. I love the process, I love the sequence of steps of breaking out the puzzle. I knew the terms proxy, VPN, and other connectivity stuff. But, I need to know the basic idea of how these things (server and client) work and communicate especially on my local network.
The questions above bring me to the topic, network analysis. It is generally, sniffering and analyzing network traffic. Luckily, Kali Linux, and other Linux distros offer the most powerful network analyzer tool, called Wireshark. It is considered as a standard package on Linux systems. Wireshark has rich functionality. The main idea of this tutorial is to do live capturing of the network, save the data into a file for further (offline) analysis process.
STEP 1 : OPEN WIRESHARK
Once we connected to the network, let’s begin by opening the wireshark GUI interface. To run this, simply enter in the terminal:
~# wireshark
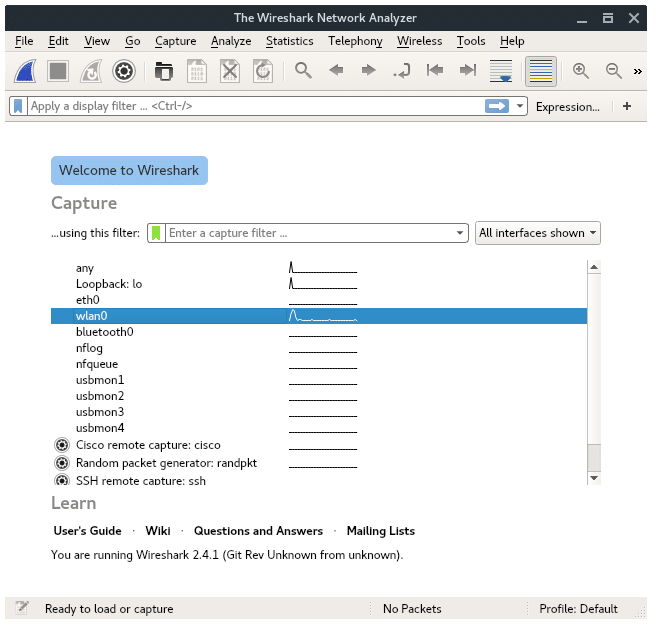
You will see the Welcome page of Wireshark window, it is should look like this:
STEP 2 : CHOOSE NETWORK CAPTURE INTERFACE
In this case we connected to an access point through our wireless card interface. Lets go a head and choose WLAN0. To start capturing, click on the Start button (Blue-Shark-Fin icon) located on left-top corner.
STEP 3 : CAPTURING NETWORK TRAFFIC
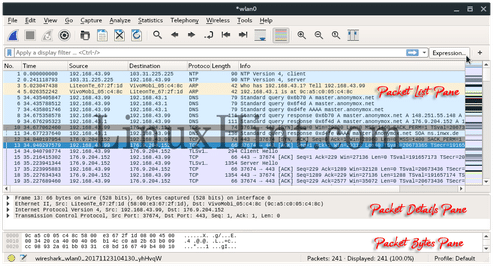
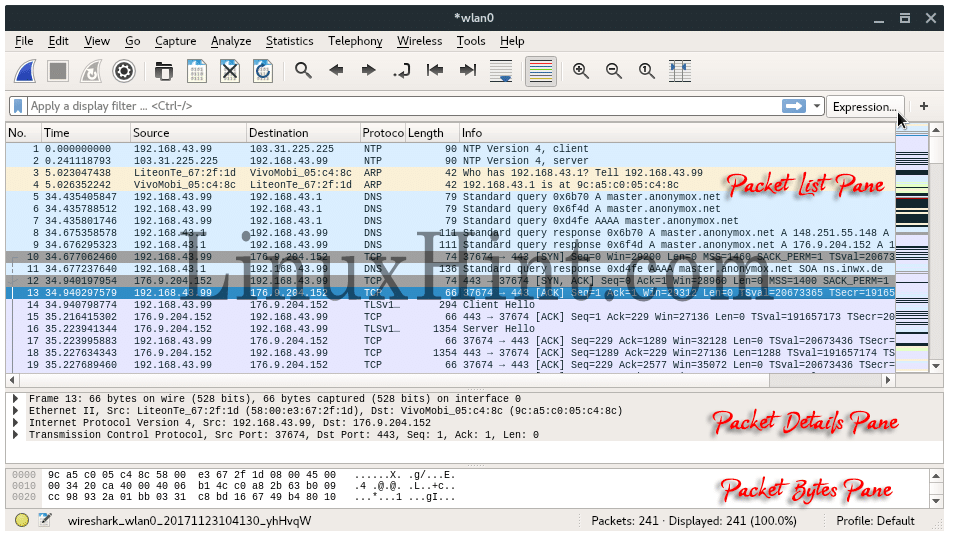
Now we bring into Live Capture WIndow. You might feel overwhelmed the first time seeing a bunch of data on this window. Don’t worry, i will explain it one by one. In this window, mainly divided into three panes, from the top to the bottom, it is : Packet list, Packet details and Packet Bytes.
-
- Packet List Pane
The first pane displays a list containing packets in the current capture file. Its displayed as a table and the columns contain: the packet number, the time captured, packet source and destination, packet’s protocol, and some general information found in the packet. - Packet Details Pane
The second pane contains a hierarchical display of information about a single packet. Click the “collapsed and expanded” to show all of the information collected about an individual packet. - Packet Bytes Pane
The third pane contain encoded packet data, displays a packet in its raw, unprocessed form.
- Packet List Pane
STEP 4: STOP CAPTURING AND SAVE TO A .PCAP FILE
When you are ready to stop capturing and view the data captured, click Stop button “Red-Square icon” (located right beside the Start button). It is necessary to save file for further analysis process, or to share the captured packets. Once it is stopped, simply save to .pcap file format by hitting File > Save As > fileName.pcap.
UNDERSTANDING WIRESHARK CAPTURE FILTERS AND DISPLAY FILTERS
You already know the basic usage of Wireshark, in general, the process is concluded with the above explanation. In order to sort and capture certain information, Wireshark has a filter feature. There are two kinds of filters which each have its own functionality: Capture filter and Display filter.
1. CAPTURE FILTER
Capture filter is used to capture specific data or packets, it is used in “Live Capture Session”, for example you only need to capture single host traffic on 192.168.1.23 . So, input the query to the Capture filter form:
host 192.168.1.23
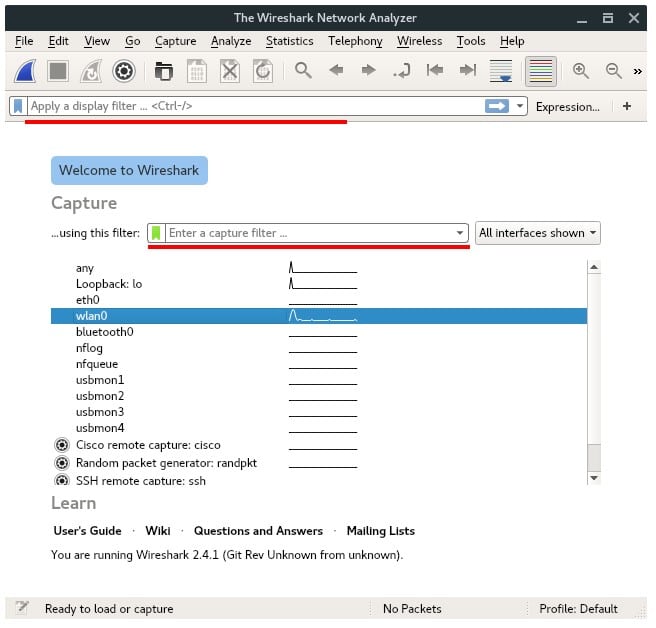
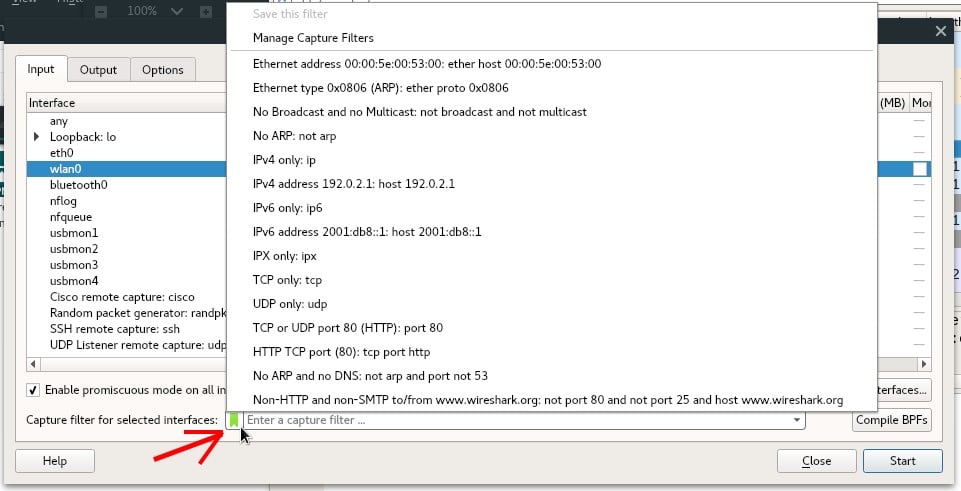
The main benefit of using Capture filter is that we can reduce the amount of data in the captured file, because instead of capturing any packet or traffic, we specify or limit to certain traffic. Capture filter controls what type of data in traffic will be captured, if no filter is set, it means capture all. To configure capture filter, click Capture Options button, which is located as shown by image in cursor pointing on below.
You will notice Capture Filter Box in the bottom, click on the green icon beside the box and select the filter you want.
2. DISPLAY FILTER
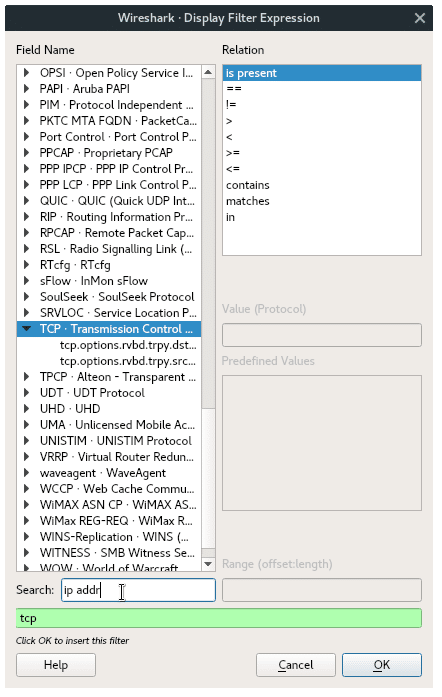
Display filter, in other hand, is used in “Offline Analyzing”. Display filter is more like a search feature of certain packets you want to see on the main window. Display filter controls what is seen from an existing packet capture, but does not influence what traffic is actually captured. You can set display filter during capturing or analyzing. You will notice the Display Filter box in the top of the main window. Actually there are so many filters you can apply, but don’t be overwhelmed. To apply a filter you can either just type a filter expression inside the box, or select from the existing list of available filters, as shown in the image below. Click Expressions.. Button beside Display Filter box.
Then select the available Display Filter argument on a list. And Hit OK button.
Now, you have the idea what is the difference between Capture Filter and Display Filter and you know your way around the basic features and functionality of Wireshark.
