Pandas for Numerical Analysis
Pandas was developed out of the need for an efficient way to manage financial data in Python. Pandas is a library that can be imported into python to assist with manipulating and transforming numerical data. Wes McKinney started the project in 2008. Pandas is now managed by a group of engineers and supported by the NUMFocus nonprofit, which will insure its future growth and development. This means that pandas will be a stable library for many years and can be included in your applications without the worry of a small project.
Though pandas was initially developed to model financial data, its data structures can be used to manipulate a variety of numerical data. Pandas has a number of data structures that are built-in and can be used to easily model and manipulate numerical data. This tutorial will cover the pandas DataFrame data structure in depth.
What is a DataFrame?
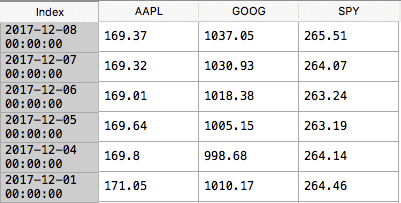
A DataFrame is one of the primary data structures in pandas and represents a 2-D collection of data. There are many analogous objects to this type of 2-D data structure some of which include the ever-popular Excel spreadsheet, a database table or a 2-D array found in most programming languages. Below is an example of a DataFrame in a graphical format. It represents a group of time series of stock closing prices by date.
This tutorial will walk you through many of the methods of the data frame and I will use a real-world financial model to demonstrate these functions.
Importing Data
Pandas classes have some built in methods to assist with importing data into a data structure. Below is an example of how to import data into a pandas Panel with the DataReader class. It can be used to import data from several free financial data sources including Quandl, Yahoo Finance and Google. In order to use the pandas library, you need to add it as an import in your code.
The below method will start the program by running the tutorial run method.
tutorial_run()
The tutorial_run method is below. It is the next method I will add to the code. The first line of this method defines a list of stock tickers. This variable will be used later in the code as a list of stocks that data will be requested for in order to populate the DataFrame. The second line of code calls the get_data method. As we will see, the get_data method takes three parameters as its input. We will pass the list of stock tickers, the start date, and end date for the data that we will request.
#Stock Tickers to source from Yahoo Finance
symbols = [‘SPY’, ‘AAPL’,‘GOOG’]
#get data
df = get_data(symbols, ‘2006-01-03’, ‘2017-12-31’)
Below we will define the get_data method. Like I mentioned above it takes three parameters a list of symbols, a start and end date.
The first line of code defines a pandas panel by instantiating a DataReader class. The call to the DataReader class will connect to the Yahoo Finance server and request the daily high, low, close and adjusted closing values for each of the equities in the symbols list. This data is loaded into a panel object by pandas.
A panel is a 3-D matrix and can be considered a “stack” of DataFrames. Each DataFrame in the stack contains one of the daily values for the stocks and date ranges requested. For instance, the below DataFrame, presented earlier, is the closing price DataFrame from the request. Each type of price (high, low, close and adjusted close) has its own DataFrame in the resulting panel returned from the request.
The second line of code slices the panel into a single DataFrame and assigns the resulting data to df. This will be my variable for the DataFrame that I use for the remainder of the tutorial. It holds daily close values for the three equities for the date range specified. The panel is sliced by specifying which of the panel DataFrames you would like to return. In this example line of code below, it is the ‘Close’.
Once we have our DataFrame in place, I will cover some of the useful functions in the pandas library that will allow us to manipulate the data in the DataFrame object.
panel = data.DataReader(symbols, ‘yahoo’, start_date, end_date)
df = panel[‘Close’]
print(df.head(5))
print(df.tail(5))
return df
Heads and Tails
The third and fourth line of get_data print the function head and tail of the data frame. I find this most useful in debugging and visualization of the data, but it can also be used to select the first or last sample of the data in the DataFrame. The head and tail function pull the first and last rows of data from the DataFrame. The integer parameter between the parentheses defines the number of rows to be selected by the method.
.loc
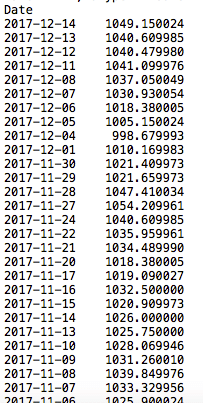
The DataFrame loc method slices the DataFrame by index. The below line of code slices the df DataFrame by the index 2017-12-12. I have provided a screen shot of the results below.
loc can be used as a two-dimensional slice as well. The first parameter is the row and the second parameter is the column. The code below returns a single value that is equal to the closing price of Apple on 12/12/2014.
The loc method can be used to slice all rows in a column or all columns in a row. The : operator is used to denote all. The below line of code selects all of the rows in the column for Google closing prices.
.fillna
It is common, especially in financial data sets, to have NaN values in your DataFrame. Pandas provides a function to fill these values with a numerical value. This is useful if you wish to perform some sort of calculation on the data which may be skewed or fail due to the NaN values.
The .fillna method will substitute the specified value for every NaN value in your data set. The below line of code will fill all of the NaN in our DataFrame with a 0. This default value can be changed for a value that meets the need of the data set that you are working with by updating the parameter that is passed to the method.
Normalizing Data
When using machine learning or financial analysis algorithms it is often useful to normalize your values. The below method is an efficient calculation for normalizing data in a pandas DataFrame. I encourage you to use this method because this code will run more efficiently than other methods for normalizing and can show big performance increases on large data sets.
.iloc is a method similar to .loc but takes location based parameters rather than the tag based parameters. It takes a zeroth based index rather than the column name from the .loc example. The below normalization code is an example of some of the powerful matrix calculations that can be performed. I will skip the linear algebra lesson, but essentially this line of code will divide the entire matrix or DataFrame by the first value of each time series. Depending on your data set, you may want a norm based on min, max, or mean. These norms can also be easily calculated using the matrix based style below.
return df / df.iloc [0,:]
Plotting Data
When working with data, it is often necessary to represent it graphically. The plot method allows you to easily build a graph from your data sets.
The method below takes our DataFrame and plots it on a standard line graph. The method takes a DataFrame and a title as its parameters. The first line of code sets ax to a plot of the DataFrame df. Its sets the title and font size for the text. The following two lines set the labels for the x and y axis. The final line of code calls the show method which prints the graph to the console. I have provide a screen shot of the results from the plot below. This represents the normalized closing prices for each of the equities over the time period selected.
ax = df.plot(title=title,fontsize = 2)
ax.set_xlabel("Date")
ax.set_ylabel("Price")
plot.show()
Pandas is a robust data manipulation library. It can be used for different types of data and presents a succinct and efficient set of methods to manipulate your data set. Below I have provided the full code from the tutorial so that you can review and change to meet your needs. There are a few other methods that assist you with data manipulation and I encourage you to review the pandas docs posted in the reference pages below. NumPy and MatPlotLib are two other libraries that work well for data science and can be used to improve the power of the pandas library.
Full Code
def plot_selected(df, columns, start_index, end_index):
plot_data(df.ix[start_index:end_index, columns])
def get_data(symbols, start_date, end_date):
panel = data.DataReader(symbols, ‘yahoo’, start_date, end_date)
df = panel[‘Close’]
print(df.head(5))
print(df.tail(5))
print df.loc["2017-12-12"]
print df.loc["2017-12-12", "AAPL" ]
print df.loc[: , "GOOG" ]
df.fillna(0)
return df
def normalize_data(df):
return df / df.ix[0,:]
def plot_data(df, title="Stock prices"):
ax = df.plot(title=title,fontsize = 2)
ax.set_xlabel("Date")
ax.set_ylabel("Price")
plot.show()
def tutorial_run():
#Choose symbols
symbols = [‘SPY’, ‘AAPL’,‘GOOG’]
#get data
df = get_data(symbols, ‘2006-01-03’, ‘2017-12-31’)
plot_data(df)
if __name__ == "__main__":
tutorial_run()
References
Pandas Home Page
Pandas Wikipedia page
https://en.wikipedia.org/wiki/Wes_McKinney
NumFocus Home Page


