For any java delopers Jmap and Jstack are two important utility programs that can be used to debug issues, or understand what your java program is doing. They are critical tools in any your toolbox that you need to know about. Therefore in this tutorial I will explain both Jstack and Jmap so you can get the idea. Let’s get started:
Troubleshooting with Jstack
Jstack is a troubleshooting tool in java that generates thread dumps of a particular JVM process, remote debug server or Java core file. This means that from whichever Java frame you use, there will be a full class name, bytecode index, method name, and the line number. Since the Jstack tool mainly deals with diagnostics, you can quickly see what the code is doing when running live.
This is among the most critical roles of the Jstack utility. Basically, it is a command line utility that attaches itself to a particular core file or process and returns all consequent threads attached to the JVM, including all the virtual machine’s internal threads and even the original stack frames. What’s more, this tool can also be used to detect deadlocks in an application so that debugging can be a bit easier. This is the best option if you are looking for a complete app diagnosis to resolve issues such as hangs and deadlocks.
Forcing a Stack Dump
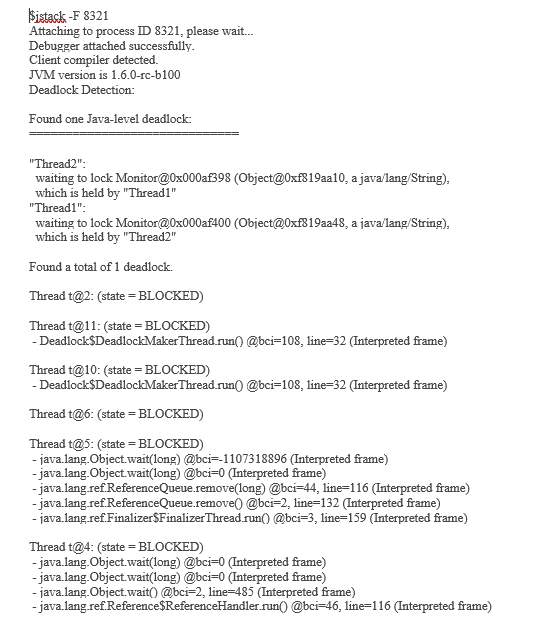
In case the system is not responding due to a hung process, getting a stack dump might be the only way to tell the origin of the problem and how to fix it. In the event that the Jstack process ID is not responding, the –F option can come in handy. Here is a screenshot of a force dump:
 Stack traces from core dumps
A core dump is simply a system or memory dump that has a record of the state of a particular file or application at a particular time and mostly when there was a problem that caused the app or program to terminate unexpectedly. Core dumps can be rigorous and have extensive information on the application. However, sometimes we only require the stack traces. To do so, we need to use the Jstack command as shown below on a core file.
$ jstack $JAVA_HOME/bin/java core
Mixed Stack
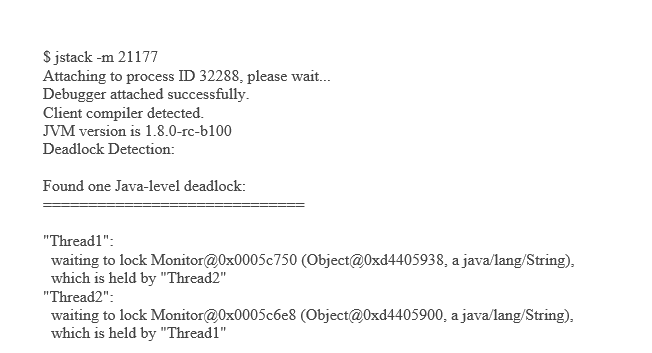
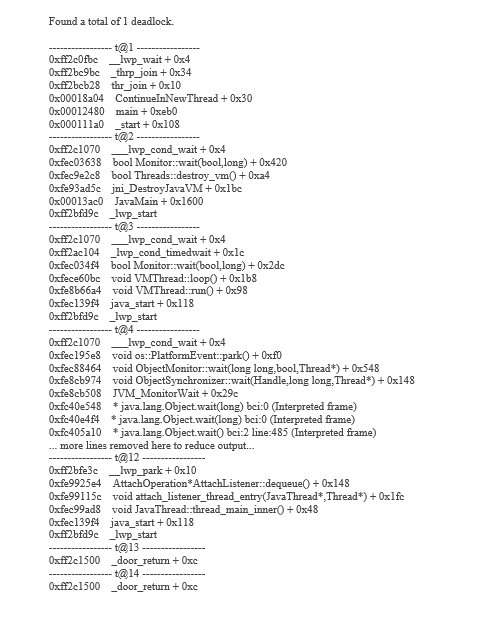
Sometimes you need more than the java stacks to identify a problem in a java application. When you need both the native stack frames and the Java stacks, the Jstack utility can be of great assistance. These native frames are frames created with C/C++. To do this, you only need the –m command as shown in the progressive screenshots below:
Jmap utility
Apps run into many issues during development. Sometimes there are memory issues such as an ever-expanding heap that never reduces despite regular garbage collection or an ArrayList which is not being released when it should. As such, we need to identify the source of the leak and patch it as soon as possible. To this end, we have the Jmap utility that takes a snapshot of the whole heap. Here are a few ways the Jmap command is used.
Heap Configuration
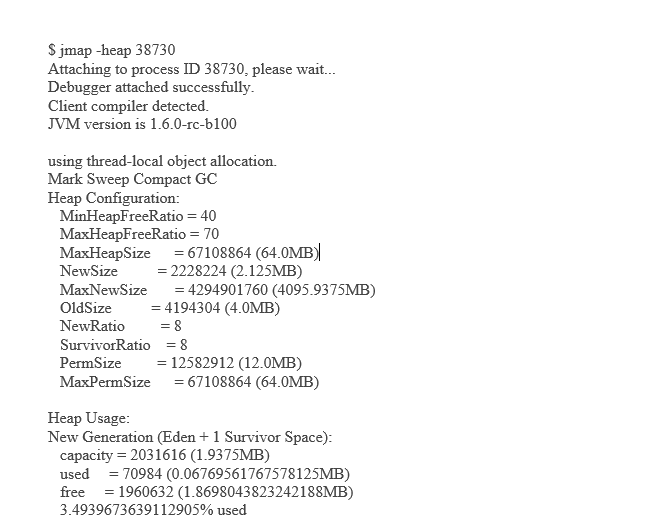
The –heap command is used to gather the following heap information:
Data specific to the garbage collection (GC) algorithms such as the name of the algorithm, e.g. serial GC and the fine print such as the number of threads for serial garbage collection, etc.
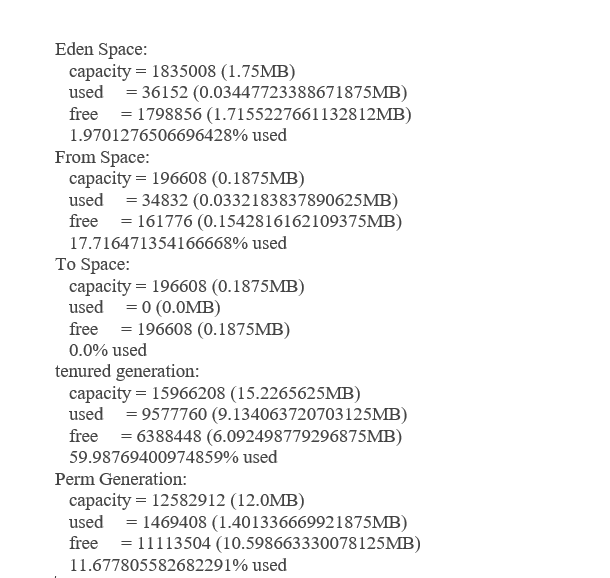
Heap usage reports: for each section of the heap (generation), the tool provides information such as total heap capacity and the memory available at the moment. Here is a screenshot of the output from the command:
Heap histogram
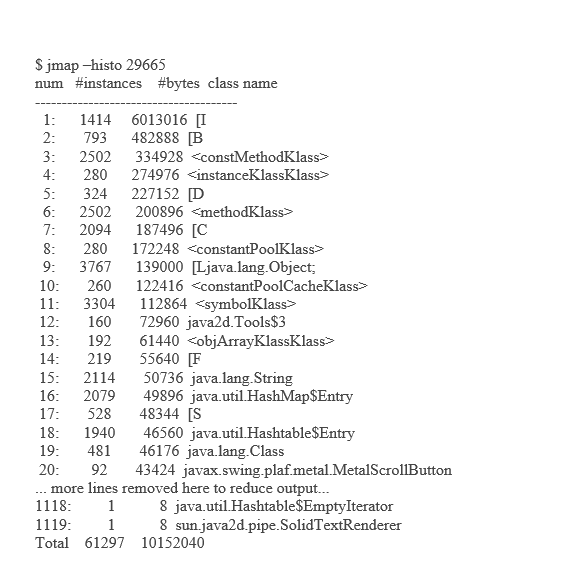
Still using the jmap utility, you can get the histogram of a heap by using the –histo option. Using the jmap –histo command, you can print the histogram of a particular core file or running process. When working on a running process, the tool prints out the memory size in bytes, number of objects and the class name. Here is a sample output of the jmap –histo command on a process with PID 29665:
Permanent Generation Statistics
The permanent generation is the sector of the heap that houses all the relevant info about the virtual machine itself. This information includes method and class objects that show where everything is. This configuration is essential especially for applications that generate huge loads for the classes present. For every loader object, we have the following details displayed:
- The total number of loaded classes
- Address of the class loader at the exact moment the utility was run.
- The number of consumed bytes by the class loader.
- If there is a parent class loader, its address is also recorded.
- A live or dead sign as to whether the loader object will be collected as garbage in future.
Sources
http://www.logicbig.com/quick-info/java/jmap/
http://www.tutorialspoint.com/unix_commands/jstack.htm
https://blog.gceasy.io/2015/08/14/how-to-capture-heap-dump-jmap/
https://www.ibm.com/developerworks/library/j-5things8/index.html
https://docs.oracle.com/javase/8/docs/technotes/tools/unix/jstack.html
https://docs.oracle.com/javase/8/docs/technotes/guides/troubleshoot/tooldescr014.html
