Detect the hardware using dmidecode
Automatic hardware detection has always been a bit like a lottery, but it got better within the last years as many manufactures document their products in more detail and have specific information available online as well. To find out about the hardware information regarding the RAM installed in your machine, use the dmidecode command (package for Debian GNU/Linux, Ubuntu and Linux Mint: dmidecode).
Among other information, this tool reports detailed data about the installed system components like the processor, baseboard, and RAM. The information is based on the Desktop Management Interface (DMI) [1], which is a framework that classifies the single components on a desktop, notebook or server by abstracting these components from the software that manages them [2]. The option --type memory refers to the memory devices. For other DMI classes have a look at the manual page of dmidecode.
# dmidecode 2.12
SMBIOS 2.7 present.
Handle 0x0007, DMI type 16, 23 bytes
Physical Memory Array
Location: System Board Or Motherboard
Use: System Memory
Error Correction Type: None
Maximum Capacity: 16 GB
Error Information Handle: Not Provided
Number Of Devices: 1
Handle 0x0008, DMI type 17, 34 bytes
Memory Device
Array Handle: 0x0007
Error Information Handle: Not Provided
Total Width: 64 bits
Data Width: 64 bits
Size: 8192 MB
Form Factor: SODIMM
Set: None
Locator: ChannelA-DIMM0
Bank Locator: BANK 0
Type: DDR3
Type Detail: Synchronous
Speed: 1600 MHz
Manufacturer: Samsung
Serial Number: 25252105
Asset Tag: None
Part Number: M471B1G73DB0-YK0
Rank: Unknown
Configured Clock Speed: 1600 MHz
This machine is currently equipped with 8G DDR3 RAM with a configured clock speed of 1600 MHz. As you can see the maximum available capacity of on-board RAM is 16G which means it can be extended by a second 8G module.
Graphical information on memory
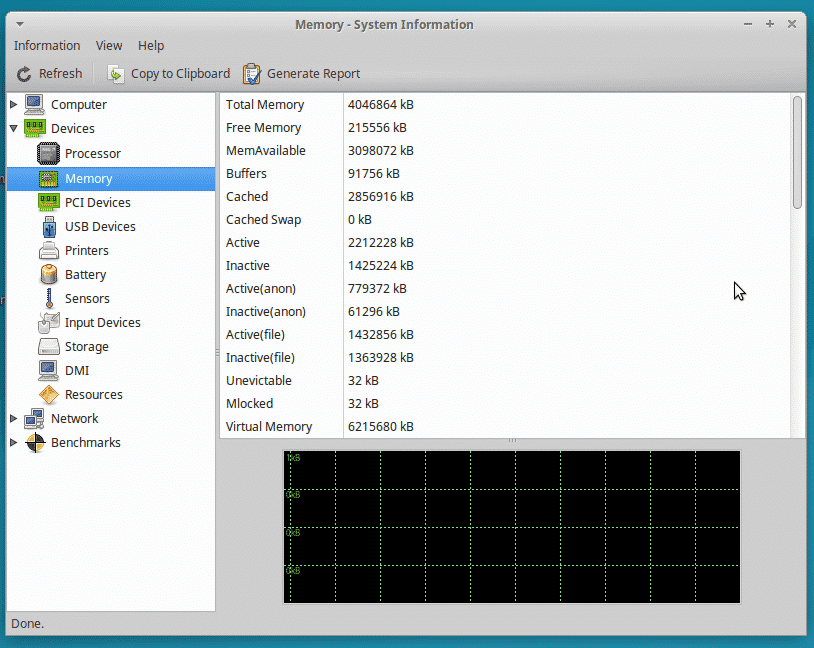
In case you prefer a graphical interface to retrieve this information the tools Hardinfo [3] and Hardware Lister (GTK+ version) [4] could be of interest to you. On Debian GNU/Linux, Ubuntu and Linux Mint these programs are available via the packages hardinfo and lshw-gtk. Figure 2 shows the user interface of Hardinfo displaying the memory information on an Xubuntu installation.
How much memory is currently available
Sometimes, less is more. On the commandline the information regarding memory is available via the free command. On Debian GNU/Linux, Ubuntu and Linux Mint this program is part of the procps package [5]. Figure 2 shows the output in a terminal window.
As a selection of the further options, free accepts various parameters such as:
-b (--bytes):show the output as bytes-k (--kilo):show the output as kilobytes-m (--mega):show the output as megabytes-g (--giga):show the output as gigabytes--tera:show the output as terabytes-h (--human):show the output in human-readable format
In figure 3 the output is shown in megabytes using the option -m. The system has 4G of RAM whereas 725M are currently in use.
Memory information from the Linux kernel point of view
The tools mentioned above rely on raw information that are kept in the proc filesystem of the Linux kernel. To show these details output the contents of the file /proc/meminfo using the cat utility in a terminal:
MemTotal: 7888704 kB
MemFree: 302852 kB
MemAvailable: 448824 kB
Buffers: 17828 kB
Cached: 326104 kB
SwapCached: 69592 kB
Active: 2497184 kB
Inactive: 650912 kB
Active(anon): 2338748 kB
Inactive(anon): 525316 kB
Active(file): 158436 kB
Inactive(file): 125596 kB
Unevictable: 64 kB
Mlocked: 64 kB
SwapTotal: 16150524 kB
SwapFree: 15668480 kB
Dirty: 3008 kB
Writeback: 0 kB
AnonPages: 2774656 kB
Mapped: 4414752 kB
Shmem: 59900 kB
Slab: 130216 kB
SReclaimable: 61748 kB
SUnreclaim: 68468 kB
KernelStack: 7328 kB
PageTables: 42844 kB
NFS_Unstable: 0 kB
Bounce: 0 kB
WritebackTmp: 0 kB
CommitLimit: 20094876 kB
Committed_AS: 10344988 kB
VmallocTotal: 34359738367 kB
VmallocUsed: 367296 kB
VmallocChunk: 34359345768 kB
HardwareCorrupted: 0 kB
AnonHugePages: 0 kB
HugePages_Total:0
HugePages_Free: 0
HugePages_Rsvd: 0
HugePages_Surp: 0
Hugepagesize: 2048 kB
DirectMap4k: 78448 kB
DirectMap2M: 2756608 kB
DirectMap1G: 5242880 kB
$
For more statistical information regarding cpu usage, memory and processes you may have a look at the tools vmstat, and iostat (Debian packages procps and sysstat).
Working with processes — ps, htop and pstree
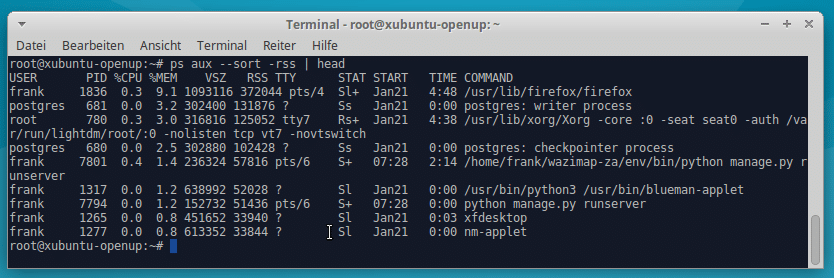
To show the active processes of your Linux system use the ps command. Usually, the output is sorted alphabetically. But the ps command can do much more. Using the options aux --sort -rss the output of the process list is sorted by their memory usage in a top-down order. Figure 4 shows the processes that have the highest demand on memory. The output is sorted by the 6th column titled RSS which abbreviates Resident Set Size. The value is given in kilobytes.
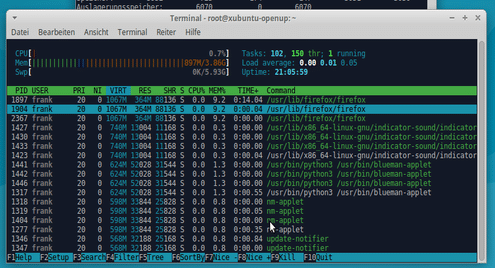
The commands ps, pstree and htop are closely related in terms of the information these tools display. Both pstree and htop display a graph to visualize the process dependencies. htop acts as an interactive version that allows you to scroll the process list up and down. Figure 5 shows htop on a desktop system with a selection of processes sorted by their specific memory usage (5th column).
Finding processes that use Swap memory
The more processes are launched the more memory is in use at the same time. As soon as your Linux system runs out of unused memory pages the Linux kernel decides to swap memory pages to disk using the Least Recently Used (LRU) method. To answer the question, which processes use swap memory and how much is used in particular, you may have a look at the output of the top program. In 2016, Erik Ljungstrom published a short description of how to retrieve that information and extend this column to the output of top [6]. Figure 6 shows this output on a system that has plenty of memory pages in RAM left and does not use Swap, currently.
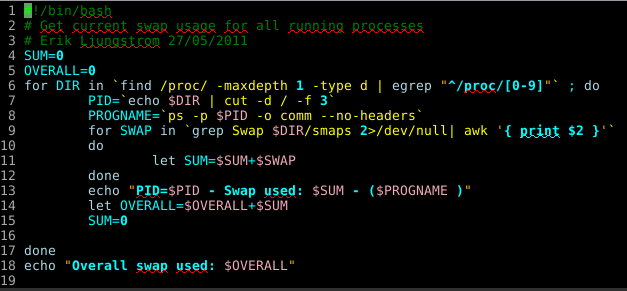
Furthermore, in 2011 he already published a bash script that evaluates the information from the proc file system to display the usage of swap process by process [7]. Even 7 years later and already described as obsolete, the script is still excellent and shows how to automate tasks on a Linux system. That is why we are certain that it is helpful to show it here once again.
The output of the script is as follows (run as root user the retrieve the full data):
PID=1 – Swap used: 0 – (systemd )
PID=2 – Swap used: 0 – (kthreadd )
PID=3 – Swap used: 0 – (ksoftirqd/0 )
PID=5 – Swap used: 0 – (kworker/0:0H )
PID=6 – Swap used: 0 – (kworker/u16:0 )
PID=7 – Swap used: 0 – (rcu_sched )
PID=8 – Swap used: 0 – (rcu_bh )
PID=9 – Swap used: 0 – (migration/0 )
PID=10 – Swap used: 0 – (watchdog/0 )
PID=11 – Swap used: 0 – (watchdog/1 )
PID=12 – Swap used: 0 – (migration/1 )
PID=13 – Swap used: 0 – (ksoftirqd/1 )
PID=15 – Swap used: 0 – (kworker/1:0H )
PID=16 – Swap used: 0 – (watchdog/2 )
PID=17 – Swap used: 0 – (migration/2 )
PID=18 – Swap used: 0 – (ksoftirqd/2 )
PID=20 – Swap used: 0 – (kworker/2:0H )
…
#
Conclusion
The Linux toolbox contains an endless list of programs available to help you to analyze the memory usage of your Linux system. We just had a short look — from raw data to preprocessed information — all of it is there. Just know your tools. To get familiar with them take a bit of time and play with them.
This is part 2 of the series on Linux Kernel Memory Management. Part 1 discusses Swap Memory, in Part Three of this series we will discuss how to optimize the usage of memory. This will include the management of ramdisks as well as compressed swap files.
Links and References
- [1] DMI at Distributed Management Task Force (DMTF)
- [2] DMI at Wikipedia
- [3] Hardinfo
- [4] lshw-gtk (Debian package for Stretch)
- [5] procps (Debian package for Stretch)
- [6] Erik Ljungstrom: Find Out What Is Using Your Swap
- [7] Erik Ljungstrom: Swap Usage – 5 Years Later
Linux Memory Management Series
- Part 1: Linux Kernel Memory Management: Swap Space
- Part 2: Commands to Manage Linux Memory
- Part 3: Optimizing Linux Memory Usage
Acknowledgements
The author would like to thank Mandy Neumeyer and Gerold Rupprecht for their support while preparing this article.


